
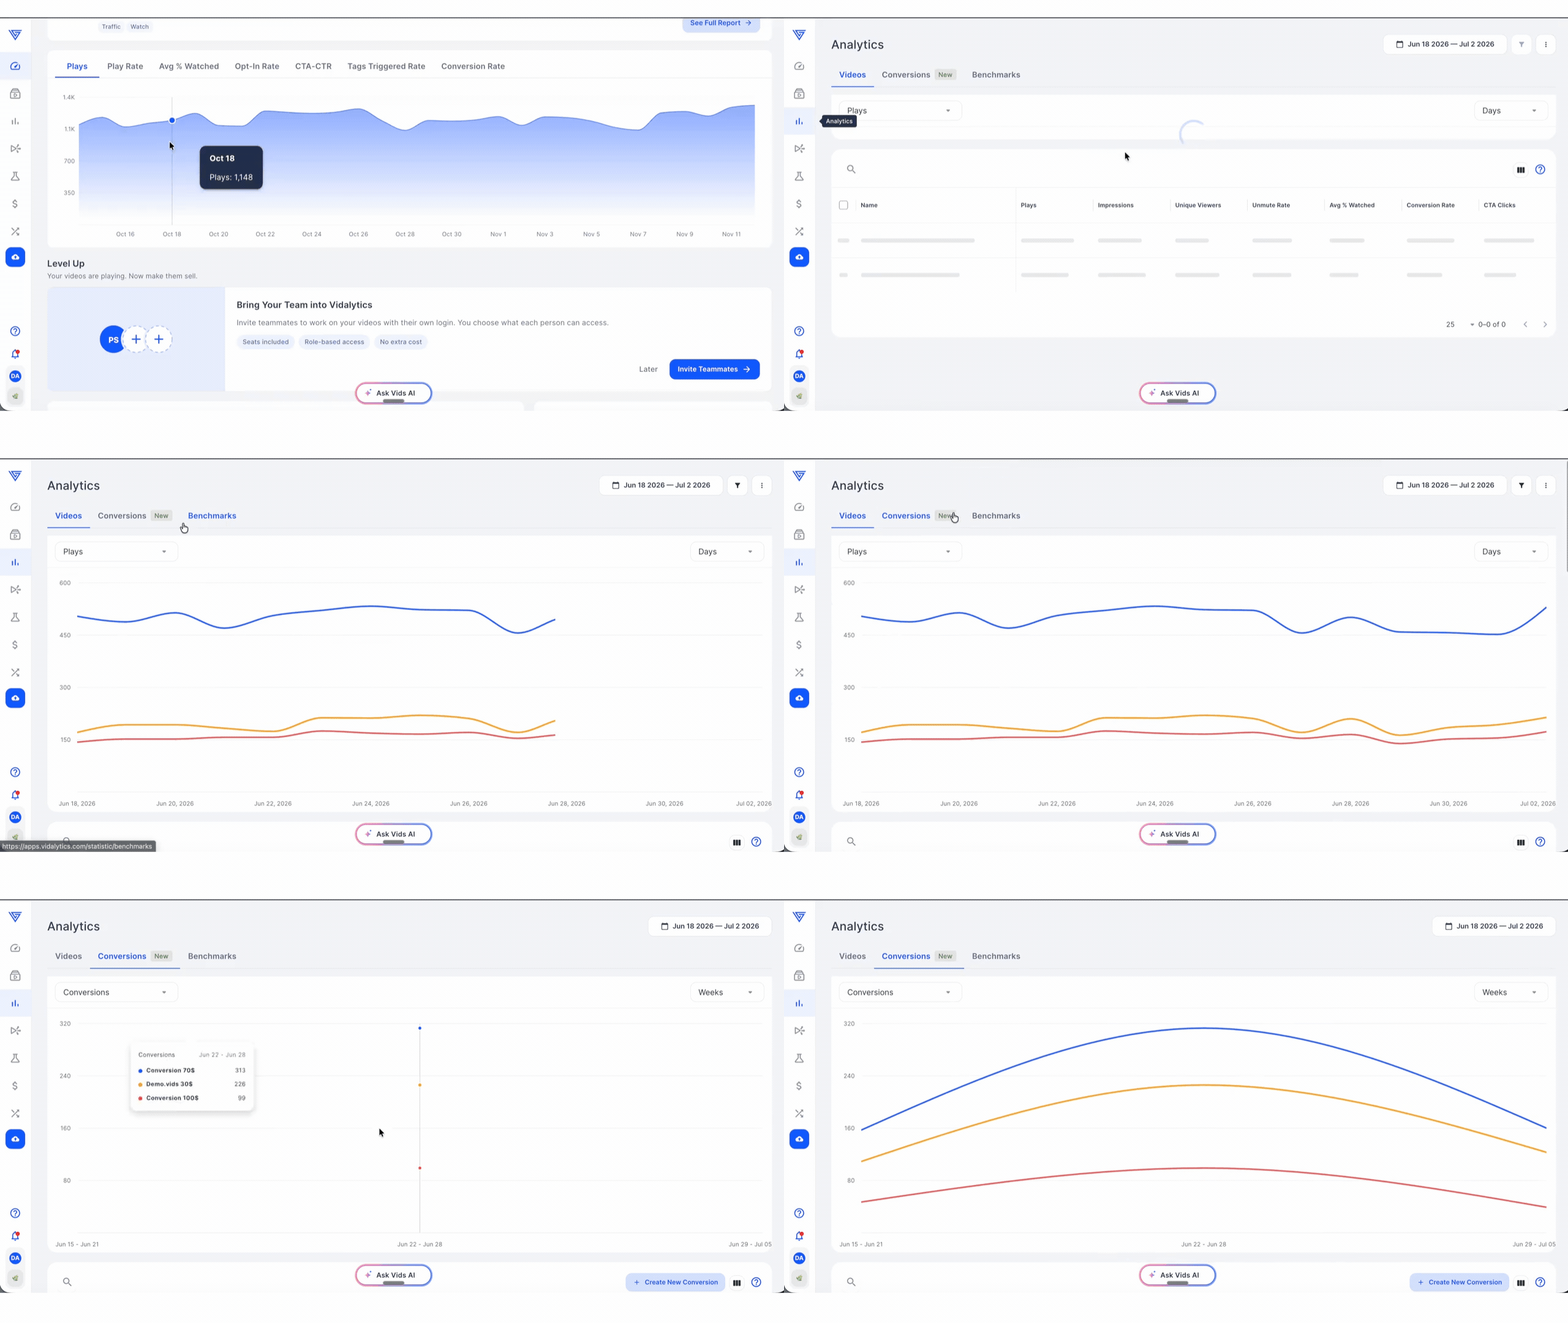
The Videos tab in Analytics is your starting point for video analytics. It shows detailed stats across your whole account, a group of videos, or a single video, with a timeline graph, a videos table, and a way to drill down into any video’s Vid Stats.
Note: This tab was previously called Analytics Home, and before that the Trends tab.
Analytics has three tabs:
- Videos: performance across your videos (this article)
- Conversions: how each conversion performs across all your videos. See Conversions Report: See How Every Conversion Performs
- Benchmarks: how your videos compare to benchmarks. See Benchmarks
The date range you pick stays the same when you switch between tabs.
What You Can Do
- View timeline graphs for one or several videos at once
- See summary stats for a group of videos
- Filter by folder to analyze a specific group of videos
- Change the filters, metrics, and time scale
- Click any video to drill down into its Vid Stats
- Export the data as a CSV file
How to Use It
- Open Analytics and select the Videos tab
- Select the videos or folders you want to analyze
- Apply filters, change the chart metric, and adjust the time scale
- Add or remove columns in the videos table to see the metrics you care about
- Click a video for deeper insights in its Vid Stats
- Export the data as a CSV file if you need it for reporting
Conversions Report
The Conversions tab shows how every conversion on your account performs, not just how each video performs. For the selected date range it lists each conversion with its Conversions, Videos, Avg. Order, Revenue, Conversion Rate, and Revenue per Viewer.
Each conversion is counted once, no matter how many videos the viewer watched before converting. This makes it the best place to see how much revenue your funnel generates when several videos lead to the same sale.
- Compare up to 5 conversions on one chart
- Click Breakdown on a conversion to see which videos it’s credited to
- Create, edit, or copy the script for a conversion without leaving the report
For the full walkthrough, see Conversions Report: See How Every Conversion Performs.
Use Cases
Compare video variants. If you run 2 or 3 variants of a video for a campaign, select them together to see side by side which one outperforms the others, then drill into each one to understand why.
Compare a group of videos. Select the videos tied to the same product or brand to see which ones perform better or worse than expected.
See which conversions drive revenue. Open the Conversions tab to compare your conversions on one chart, then use Breakdown to see which videos are credited.
Why Do the Numbers Look Different From the Conversions Tab?
The Videos tab counts a conversion on every video the viewer watched before converting. The Conversions tab counts each conversion once. Conversions and Revenue totals can therefore be higher on the Videos tab.
If you have any questions, reach out to our Customer Happiness Team at hi@vidalytics.com.