
Script Map lets you define the structure of your video — Hook, Story, Offer, Close, or whatever sections make sense for your content — and then read your analytics through those labels instead of raw timestamps. Select a section on the engagement graph and every metric below recalculates for that part of the video, making it easy to spot drop-off points, understand what drives conversions, and compare how different parts of your script perform.
Note: Script Map is invisible to your viewers. It exists only inside your analytics and has no effect on video playback. It is not the same as Chapters, which are a player feature your viewers can see and click.
Availability & Restrictions
- Available on Pro, Premium, and Enterprise plans
- Free and Starter plan users will see the Script Map toggle locked with an upgrade prompt
- Not available in Experiments views, Compare Period, or Compare Videos
- A video can have up to 50 sections
- Script Map works on each video's own Vid Stats independently — there is no cross-video side-by-side comparison in this release
How to Set Up a Script Map
Open View Settings — go to the Vid Stats page for the video you want to analyze, open View Settings, and locate the Script Map section.
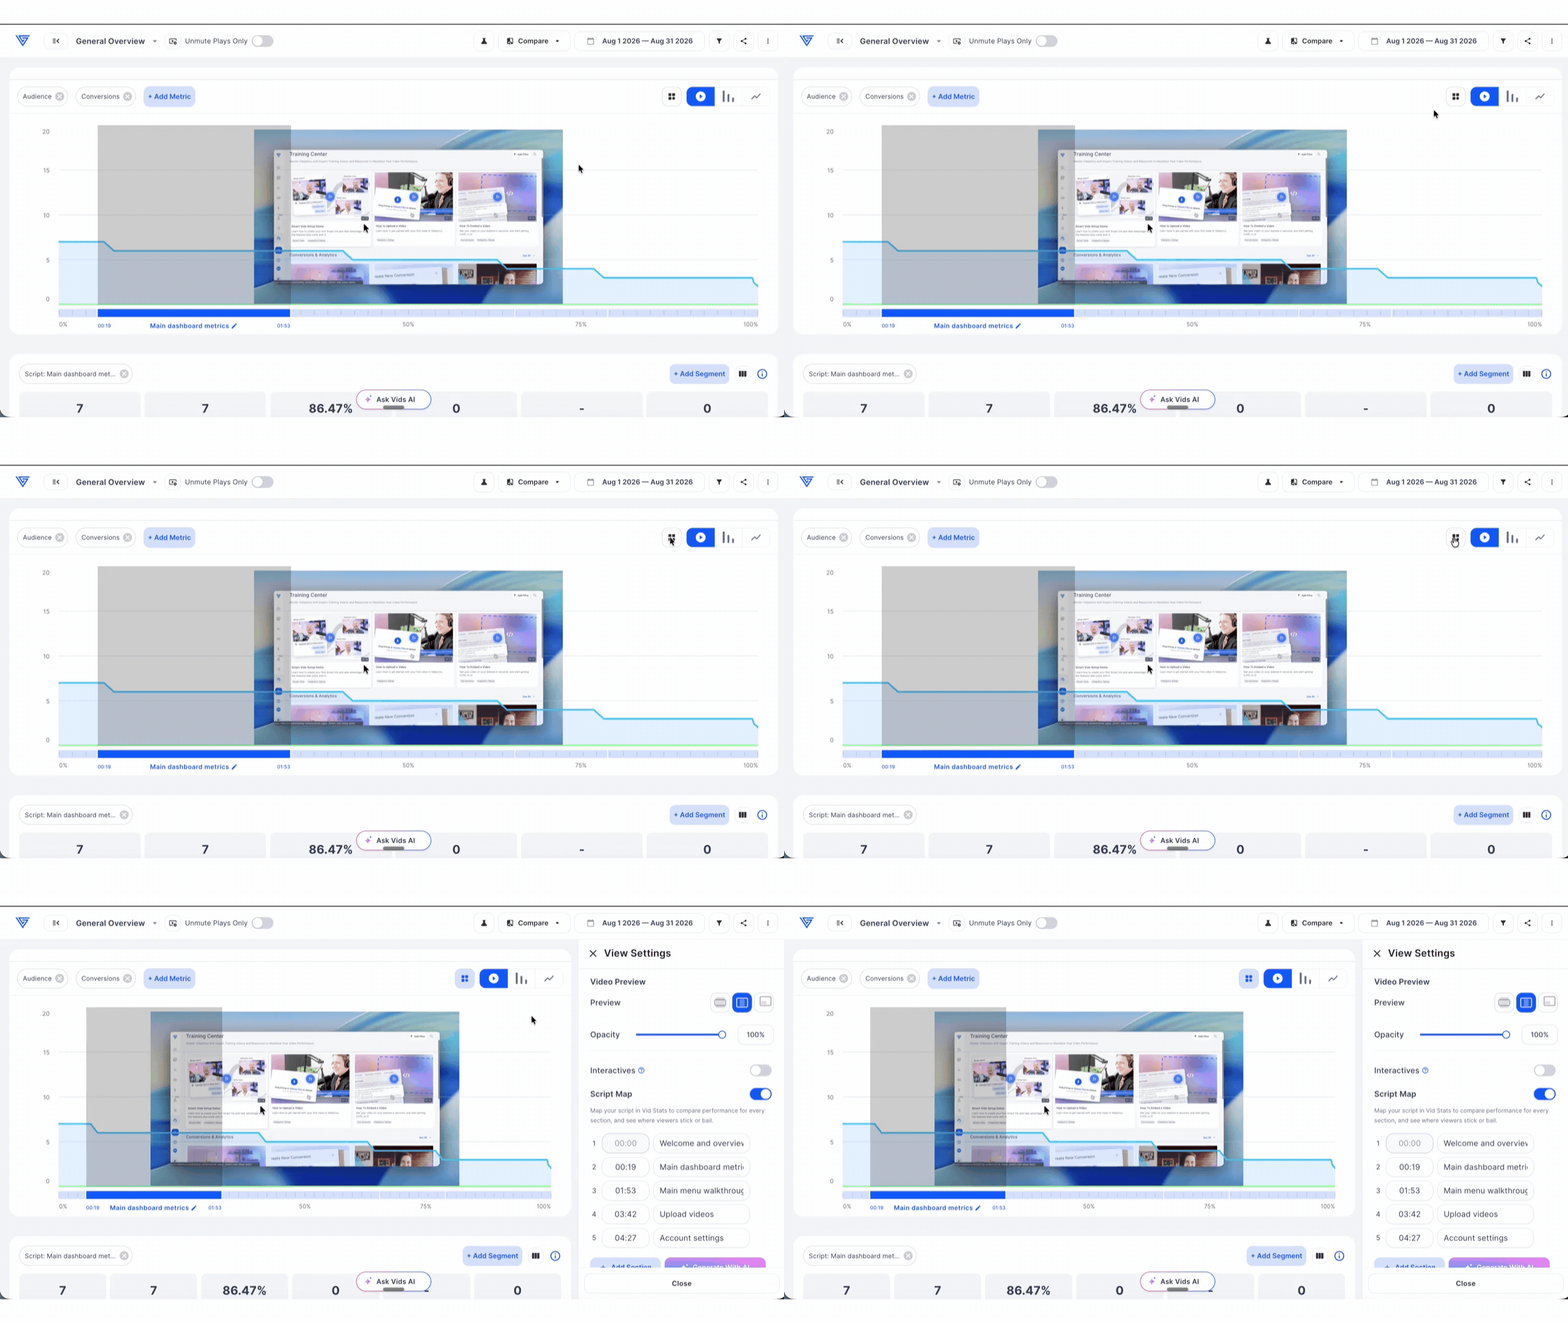
Enable Script Map — toggle Script Map on. A default section is created automatically starting at 00:00 and running to the end of the video, labeled "Section 1."
Build your map — you have two ways to define your sections:
- Add sections manually — click Add Section for each part of your script. Set the start time and give it a label (for example: Hook, Problem, Story, Offer, Close). End times are filled in automatically based on the next section's start time
- Generate with AI — click Generate with AI to have Vidalytics propose a section structure based on your video's transcript. The AI reads your captions and snaps each section start to the nearest caption cue so labels line up with what is actually being said
Changes save automatically. You can edit section names and timings at any time.
Note: Generate with AI requires the video to have closed captions. If no captions exist, an error will appear and no map will be generated.
Analyzing Metrics by Section
Select a section — with Script Map enabled, hover over any section on the engagement graph to see its label and time range. Click a section to select it and filter all metrics below to that part of the video. Click it again to deselect.
When a section is selected, the metrics panel shows:
- Plays — plays by viewers who reached the section
- Unique Viewers — viewers who reached the first second of the section
- Avg % Watched — how much of that section the average viewer watched
- Completion Rate — viewers who reached the end of the section out of those who reached its start
- Conversions — conversions attributed to that section
- Conversion Rate — viewers who converted in the section out of those who reached it
- Revenue — revenue from conversions in that section
- Revenue per Viewer — section revenue divided by viewers who reached it
- Avg. Order Value (AOV) — average order value for conversions in that section
Important: Play Rate, Bounce Rate, Impressions, Unmute, and Play Gate / CTA metrics are whole-video metrics only. While a section is selected, these will appear blank. This is expected behavior — clear the section filter to see them again.
Using Script Map With Segments
Enable audience segments while a section is selected to see that section's metrics broken down by segment in the table below. Each segment row shows its own metrics for that specific section. Clear the section filter to return the table to whole-video figures.
Using a Section as a Funnel Step
Open Funnel View and use the step picker to add a Script Map section as a funnel step. Your sections appear under a Script Map group, labeled by their names. A section step counts the unique viewers who reached that section's start point and sits in the funnel at the correct position relative to your other steps.
Exporting Section-Level Analytics
Select a section on the graph, then open More Actions and run a Summary export as CSV or Excel. The export respects the active section filter and adds a Script Map Section column with the section label. Whole-video-only metrics will appear blank in the export for section-filtered rows.
Sharing a Report With a Section Selected
Script Map is supported in Share Stats. A share link can carry a selected section, so you can send a client or media buyer a link that opens directly on a specific section's metrics — no login required.
A Few Things to Keep in Mind
- Script Map works on all historical data for the video immediately — there is no need to wait for new traffic after creating a map
- Turning Script Map off hides the sections but does not delete them — they come back intact when re-enabled
- If you replace your video file, your section start times do not shift automatically. If the new video is cut differently, review and adjust your sections after the swap
- Script Map and Interactives (CTA, Play Gate, and Product markers) can both be displayed on the graph at the same time, but only one can be selected at a time — selecting one clears the other
If you have any questions, feedback, or need assistance, feel free to reach out to our Customer Happiness Team at hi@vidalytics.com.