
The Conversions Report is a tab in Analytics that lists every conversion on your account with its performance for the date range you select. Each conversion is counted once, no matter how many videos the viewer watched before converting. You can click into a conversion to see which videos it’s credited to.
Availability & Restrictions
- Available starting on Pro Plan and up.
- Covers only conversions tracked by conversion scripts created on the Conversions page. CTA clicks and custom on-page events are separate metrics
- Segments and compare mode are not supported in this tab
- Revenue cannot be broken down by product
- Sub-users without the conversions permission don’t see the entry points to the report
What Changed in Analytics and the Dashboard
- The Trends tab in Analytics is now called Videos
- The Dashboard no longer has a Conversions tab in its table or the conversion breakdown. That analysis now lives in the Conversions Report. The Conversions and Revenue summary cards and the Conv. Rate chart tab stay on the Dashboard
- Traffic Source moved into the Device Type / Location widget as a new tab, with the same data as before
How to Review Conversion Performance
- Open Analytics and click the Conversions tab
- Pick a date range. It stays the same when you switch between Analytics tabs
- Review the table, which lists every conversion on the account, including ones with no conversions in that range
- Select up to 5 conversions with the row checkboxes to plot them on the chart. The top 3 by Conversions are selected by default
- Choose the chart metric (Conversions, Revenue, Avg. Order, or Conversion Rate) and the interval
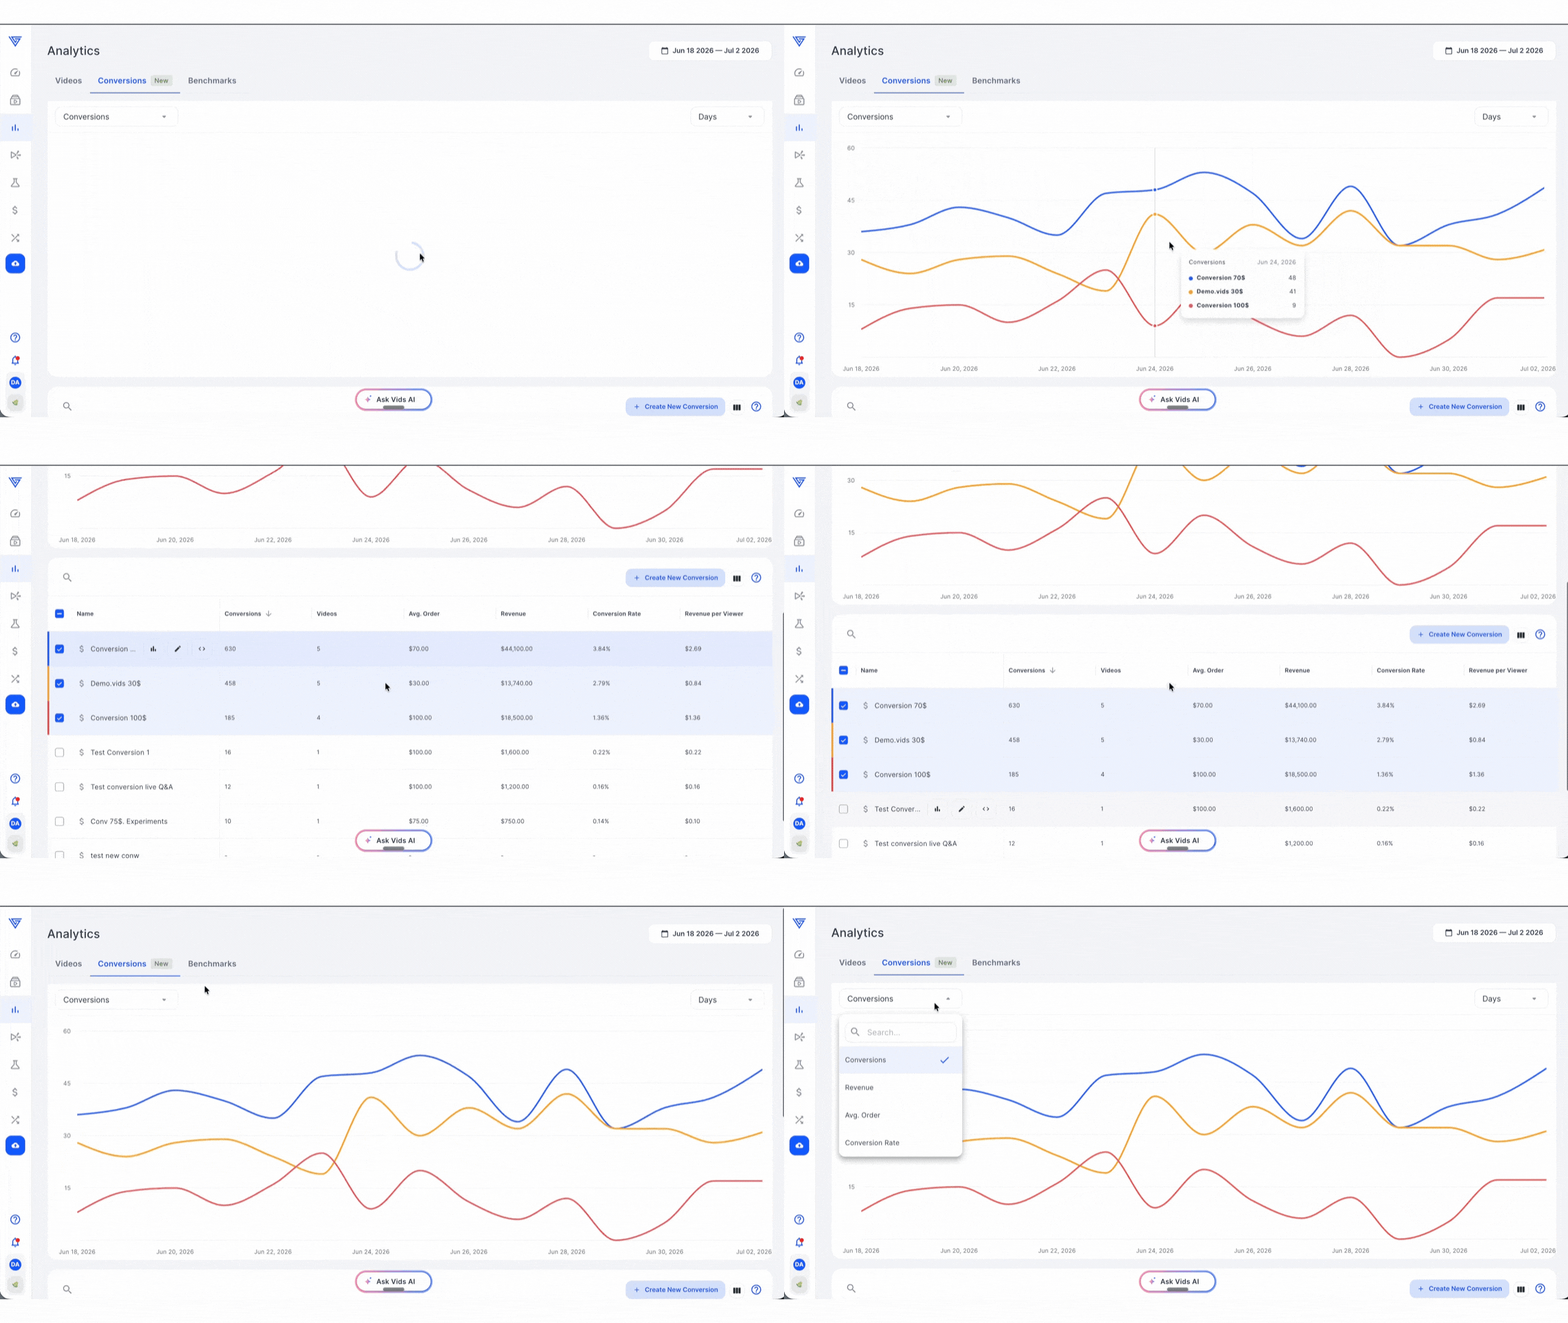
Table columns
- Conversions: the number of separate conversions of that type
- Videos: the number of videos credited with at least one of that conversion in the date range
- Avg. Order: Revenue divided by Conversions
- Revenue: the total value of those conversions
- Conversion Rate: unique viewers who converted, divided by unique viewers of all videos credited with that conversion. This is one rate for the whole conversion, not an average of per-video rates
- Revenue per Viewer: Revenue divided by unique viewers of all videos credited with that conversion
See Which Videos a Conversion Is Credited To
Hover over a conversion’s row and click Breakdown. The Videos tab opens filtered to that conversion, showing metrics for that conversion only. Videos with no conversions of that type in the date range are hidden.
Note: The video rows won’t add up to the summary row. One conversion is credited to every video the viewer watched before converting, so it appears on each of those rows. The summary row counts it once and matches the conversion’s row in the Conversions tab
Create, Edit, or Copy a Conversion Script
From the report you can:
- Click Create New Conversion to open the Conversions page with the Create Conversion dialog open
- Click Edit on a row to open that conversion’s Edit Conversion dialog
- Click Copy Script on a row to copy the conversion code. A “Conversion code copied!” message confirms it, and you stay on the report
Other Ways to Open the Report
- Conversions page: Click the Conversion Report button in the header. The chart icon in a conversion’s row actions opens the report with only that conversion selected
- Experiments: Click the link at the end of the Conversions column header tooltip
- Dashboard: Click See Conversion Report in the “Looking for conversion analytics?” banner
The report opens with the date range of the page you came from.
If your account has no conversions yet, the tab shows a setup screen instead. Start Tracking Conversions And Revenue opens the Create Conversion dialog.
How Conversions Are Counted
- Counting setting: Each conversion’s setting is respected. “One conversion per viewer” counts once per viewer, and “Every conversion” counts every event
- Filters: The report uses the same play filters as the Videos tab, such as bot filtering and blocked IP addresses
- Dating: A conversion is dated by the viewer’s last play of a credited video before converting, not by the purchase date. A purchase made a few days after watching appears on the day of that play, so daily numbers can differ from Stripe, Shopify, or your checkout platform
- Videos tab totals: The Videos tab without a conversion filter counts a conversion on every video the viewer watched, so its Conversions and Revenue totals can be higher than in this report
If you have any questions, reach out to our Customer Happiness Team at hi@vidalytics.com. 😊